
Deteriorating Expectations for Global GD
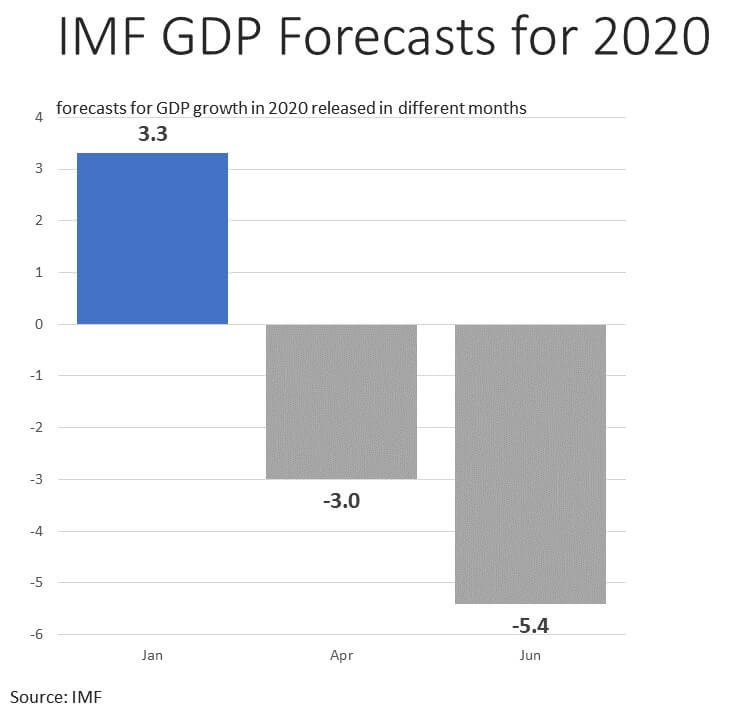
As recently as late January, the International Monetary Fund (IMF) was forecasting 2020 to be a year of accelerated global growth (from 2.9% in 2019 to 3.3% in 2020).
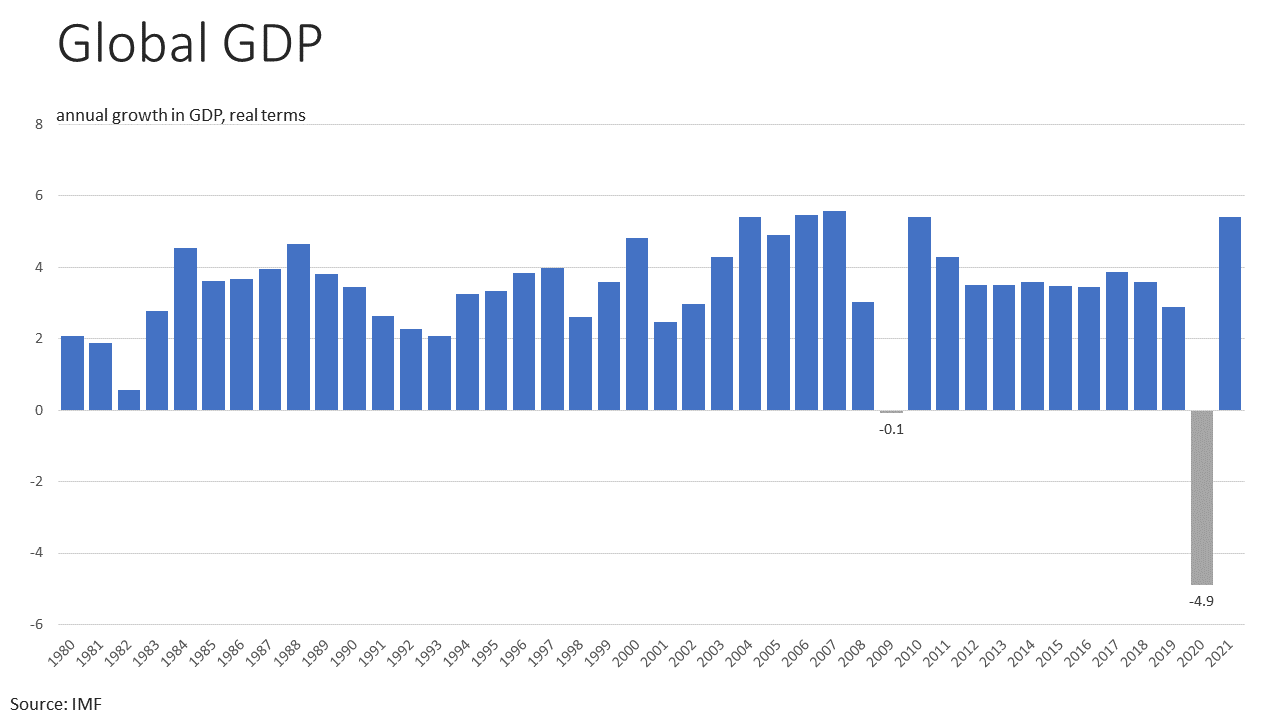
With the spread of COVID, there was a sharp reversal in expectations. Projections released in April called for the steepest contraction in their database (-3.0%, estimates back to 1980).1 More recent figures, released in late June, show the IMF lowering their projection further to 4.9%.
The World Bank also released a projection in June, suggesting that there would be a 5.2% contraction in 2020. This would be the steepest drop since World War II and one of only four contractions larger than 5.0% in their database (figures back to 1870s; other steep declines are WWI, the Great Depression, and WWII). For a recent comparison, the World Bank estimates the global economy shrank 0.7% in 2009 with the financial crisis.2
Record Job Losses (U.S.)
In April, 20.7 million jobs were lost, and the unemployment rate shot up to a record level (14.7%, data back to 1948). The speed of change is remarkable. In February, the unemployment rate was the lowest since the late 1960s (3.5%). In May, an estimated 2.5 million jobs were added. However, the Bureau of Labor Statistics noted that they are having sampling and classification issues (e.g., how to classify temporarily laid-off workers).3
20.7 million jobs
lost in April 2020
Record Monthly Drop in Consumer Confidence in April (U.S.)
The decline in April was from a high level. In May, values stabilized. The current level for the Index of Consumer Confidence remains well-above those during the financial crisis (index was as low 25 in 2009, it is currently near 85, the long-term average is 95).4
Record Drop in Consumer Spending (U.S.)
Overall
Year-over-year, total spending was down 4.4% in March and 17.3% in April. For comparison, the worst year-over-year decline in total spending during the 2008-09 financial crisis was -2.4%.5
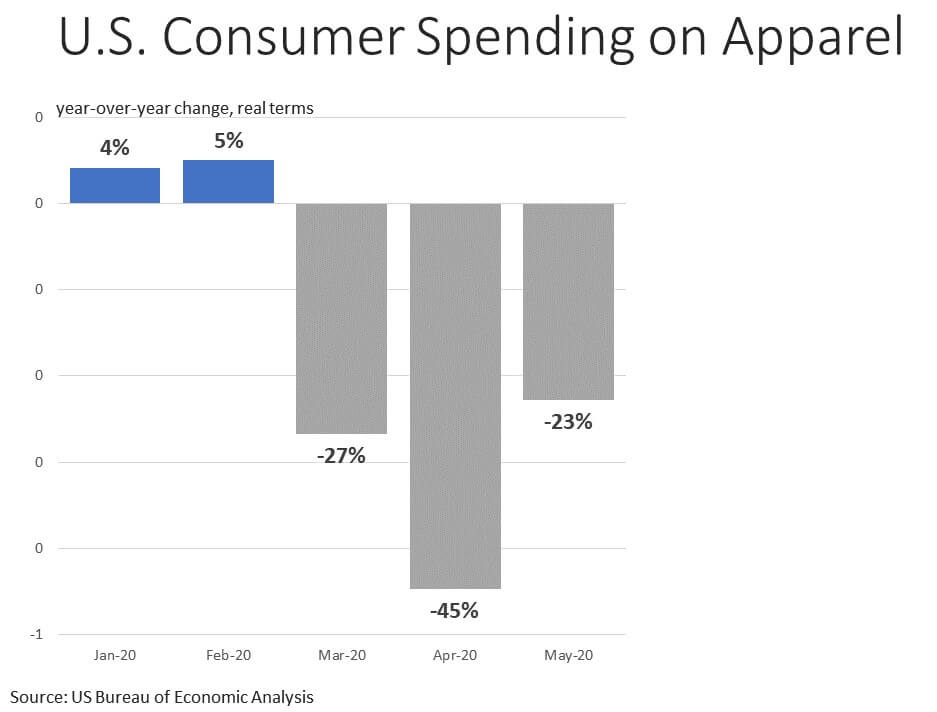
On Apparel
Year-over-year, spending on apparel was down 27% in March, 48% in April, and 23% in May. Before COVID, apparel spending was healthy, with the rate of annual increase well-above the longer-term average (+3.7% year-over-year over the twelve months ending in February 2020 versus an average of +2.2% from January 2013 to February 2019).5
Record Drop in Retail Apparel Prices (U.S.)
The CPI for garments now at its lowest level since 1987.7 The collapse in consumer spending volume, along with lower margins on discounted items, has meant evaporation of retailer revenue.
A cash crunch among retailers has resulted in order cancelations, renegotiated/delayed payments, and bankruptcy proceedings.8,9,10
Record Increase in Retailer Inventory/Sales Ratios6
Retailers had inventory already in stores and more arriving when the virus hit. Seasonal items cost money to warehouses and may be difficult to sell next year if fashions change. Discounting has been used to help move product.
Retailers Were Dealing with Tariffs Before COVID
Tariffs on Chinese-made garments went into effect in September 2019.11
Tariffs did have the intended effect of reducing sourcing from China. However, other markets have not been able to fully capture the share lost by China, and a net result has been a decrease in overall import volume.12
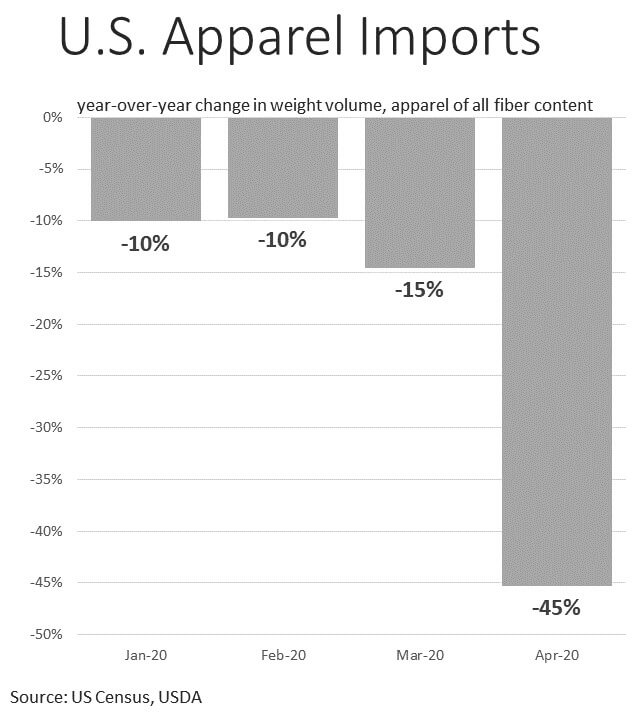
In terms of all-fiber weight, apparel imports were down 8% year-over-year from September to February (tariffs-only).
In March and April (tariffs-plus-COVID), all-fiber apparel import weight was respectively down 15% and 45% year-over-year.
For cotton-only weight, apparel imports were down 7% year-over-year from September to February (tariffs-only).
In March and April (tariffs-plus-COVID), cotton apparel import weight was down 13% and 46% year-over-year.
Record Downward Revisions to USDA Forecasts for Mill-Use13
Declines in retailer orders are not unique to the U.S.; COVID is global. Since January, the USDA estimates for global mill-use estimates in 2019/20 have fallen 15%.
Production estimates have not changed much, and a large increase in stocks is expected. In 2020/21, another surplus is projected, and stocks are expected to approach the record from 2014/15.

The World is Working on a Solution
This is a global pandemic, and given the stakes, medical researchers everywhere are looking for a breakthrough. If found, a breakthrough could lead to a sharper than expected increase in demand throughout supply chains.
A Rebound in Global Economic Activity is Expected in 2021
The IMF (+5.4%) and that World Bank (+4.2%) are predicting world GDP to grow at the strongest rate since the recovery that followed the financial crisis in 2021.2
Certain Retailers Have Been Recording Solid Apparel Sales
Online sellers and operations with attached grocery/pharmacy operations that were able to secure essential labels have been reporting strong apparel sales.14
Savings Rate Climbed to a Record 33% in April15
The savings rate climbed to a record 33% in April (Bureau of Economic Analysis). Stimulus checks and additions to unemployment payments boosted incomes. With spending lower, an implication is that savings were higher. In the face of a struggling labor market, those savings may or may not be able to stretch through to the recovery. But if savings do persist, saved money may boost spending and support a steeper recovery.
A Rebound in Cotton Consumption is Expected
Global cotton mill-use is strongly correlated with global economic growth. The USDA expects mill-use to bounce from 102 to 114 million bales during the 2020/21 crop year.13
U.S. acreage and production are expected to be near the level from last year. The current forecast for a 19.5 million bale U.S. crop is well-above the lows near 12 million bales suffered between 2008 and 2015.13
Current Forecast:
19.5 million bale U.S. crop
High Levels of Global Stocks Make a 2010/11-Type Spike Unlikely
The 2010/11 spike was a partial result of a resurgence in demand that followed the recovery from the last recession. The loss in share that followed was an impediment for demand growth in the decade following the spike. Adequate stocks should allow cotton demand to rebound in step with global economic growth.16